How to Track Your Brand's AI Visibility
AI visibility is a probability, and one ChatGPT spot check cannot measure it. The five numbers worth tracking, a manual baseline method, and the two ways teams get the measurement wrong.
Author
Founder
Abhilash is the Founder of Paprik AI. He writes about AEO, AI search visibility, and how brands can win in AI-driven discovery.
Most teams first check their AI visibility the same way: open ChatGPT, ask "what are the best tools for X", and see whether their brand comes up. It is a reasonable instinct and a poor measurement. AI answers vary between runs, accounts and days - the same question can name you on Monday and skip you on Tuesday without anything about your brand changing. A single spot check is one sample from a distribution, and reading it as a verdict leads to both false alarm and false comfort.
What is actually measurable is the probability: across many runs of the questions your buyers ask, how often does the answer name you? Paprik's research on personalization found that AI engines reshuffle a fairly stable shortlist rather than inventing a new one per user - which is exactly why a repeated, sampled measurement works where a spot check fails. This guide covers what to track, how to build a baseline by hand, and the two mistakes that quietly invalidate the numbers. (It is about measuring your presence inside the answers; for measuring the traffic those answers send you, see how to measure AI search driven traffic.)
The five numbers worth tracking
Whatever you call the discipline - AEO or GEO - the measurement layer is the same five metrics:
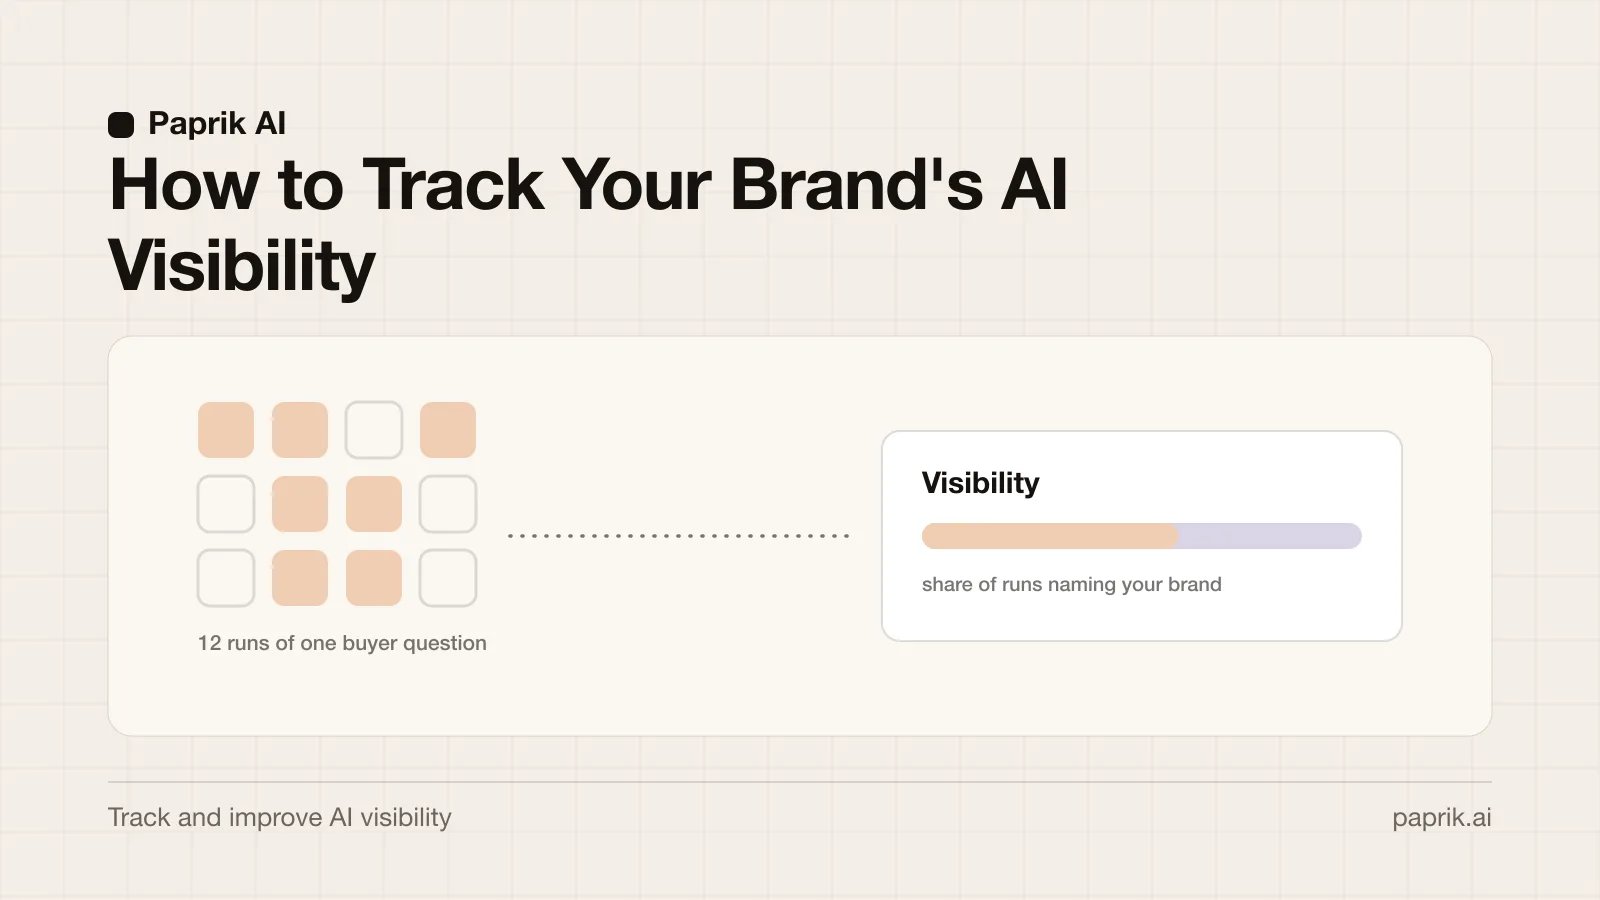
Visibility rate. Of all the runs of your tracked questions, the share whose answer mentions your brand. This is the headline number, and it only stabilises across repeated runs.
Share of voice. Of all brand mentions across those answers, the share that are yours. Visibility says whether you appear; share of voice says how much of the conversation you own relative to competitors.
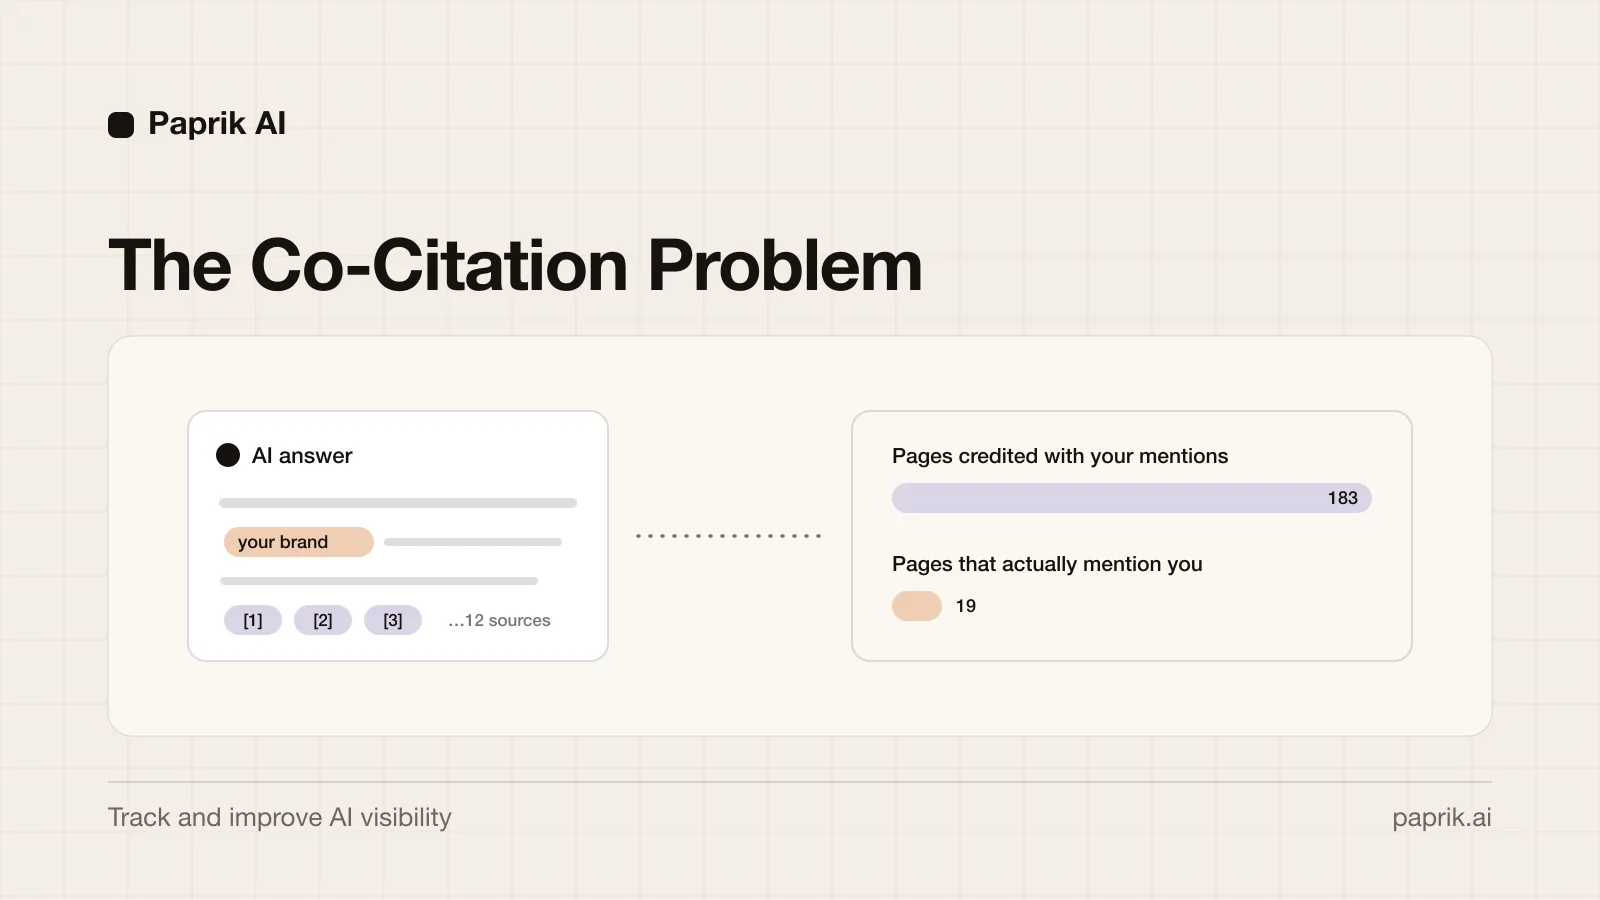
Citation rate. How often your own pages appear as sources behind the answers. A brand can be mentioned without being cited and cited without being mentioned - the two are different wins and move independently.
Sentiment. How the answer characterises you when it does name you. Appearing in an answer that talks a buyer out of the sale is not a win.
Accuracy. What the answers claim about you, checked against what is true. Wrong pricing, dead products and misattributed facts show up in AI answers routinely, and they are invisible unless you read the answers themselves.
Rates and shares only - never raw counts. Ten mentions across twenty runs and ten across two hundred are very different results.
The prompt set is the instrument
Before any of those numbers means anything, you have to decide which questions to run. There is no keyword-volume file for AI answers; the prompt set is the measurement instrument, and a wrong one measures the wrong market. Build it from the questions buyers actually ask at each stage - problem framing ("how do I reduce cart abandonment"), category research ("best tools for X"), comparisons ("X vs Y"), and validation ("is X worth it") - not from the keywords you rank for. In a typical B2B category that comes to 40 to 80 distinct buying questions. Start narrower if you must, but start representative: five comparison prompts tell you nothing about the problem-framing questions where categories are actually won.
A manual baseline that works
Below roughly ten prompts on one or two engines, a spreadsheet is a perfectly good instrument:
Pick 10-20 prompts covering the stages above.
Run each prompt in the engines that matter for your category - ChatGPT and Google's AI results are the usual floor - in a logged-out or clean session.
Record, per run: brand mentioned (yes/no), position among mentioned brands, competitors named, and which URLs the answer cites.
Repeat the full set on several different days - at least three, ideally a week apart from first to last - before computing anything.
Compute visibility, share of voice and citation rate across all runs, not per day.
The repetition is the method. One pass produces anecdotes; the same set run five times produces a baseline you can compare against after you change something.
The two ways teams get this wrong
Reading one run as a verdict. A single "we're not in the answer" screenshot triggers panic and a single "we're in!" triggers complacency, and both are noise. Visibility is a rate; treat every individual answer as one sample.
Building the dashboard on the API. The engineering instinct is to script the measurement against the model's API, which produces a stable, automatable pipeline - measuring the wrong thing. Paprik ran the same 35 prompts through the ChatGPT UI and the OpenAI API for 10 days: the API surfaced an 84% smaller brand universe (135 brands against the UI's 845 across 300 responses), erased real competitors and invented stale ones. Buyers use the product interface, with web search, so that is what a tracking setup has to sample.
Where analytics can and cannot help
Your analytics will not tell you your AI visibility - and it under-reports even the traffic AI sends you, because users read an answer, open a new tab and type your brand name, landing as direct or branded-search traffic. Tally, the form builder, only discovered AI search was their top acquisition channel by adding one "How did you find us?" question at onboarding. Run that survey by all means, but treat it as measuring downstream traffic. The answers themselves have to be sampled directly, which is what everything above does.
When a tool earns its keep
The spreadsheet stops scaling on three axes at once: prompt count (40-80 for a real category), engine count (buyers now spread across seven), and time (a baseline needs runs every day, not when someone remembers). Past that point the work is automation, not judgement, and a tracking platform earns its keep - it runs your prompt set daily across engines and turns the runs into the five metrics above, with the answer text kept for reading. That is the job Paprik was built for, and whichever tool you pick, apply the API test from the section above before trusting its numbers.
Frequently asked questions
How many runs does it take before an AI visibility number is reliable?+
More than one, and the smaller the prompt set the more repetition it needs. As a floor, run the full set on three separate days before treating the rate as a baseline; a trend needs a few weeks. A number that swings wildly across those runs is itself information - it usually means the engine has no settled shortlist for that question yet.
Which AI engines should I track first?+
The ones your buyers use, which is partly a category question. ChatGPT plus Google's AI results (AI Overviews and AI Mode) is the common floor since Google is where existing search demand already sits. Add Perplexity, Gemini, Claude or Copilot when your audience skews toward them - developer and research-heavy categories in particular.
What is a good AI visibility score?+
There is no universal benchmark - it depends on how many brands a category answer names and how concentrated the category is. The useful comparisons are relative: against your own baseline over time, and against your competitors on the same prompt set over the same window. A rising rate on stable prompts is the win condition.
Can I track AI visibility through the ChatGPT API?+
Not if you want numbers that reflect what buyers see. The API without web search answers from training data - it misses new content entirely and, in Paprik's testing, surfaced 84% fewer brands than the ChatGPT interface on identical prompts. Any tracking setup, home-built or bought, should sample what the product interface actually returns.